|
Exploration |
|
|
|
Rotary Rigs |
|
|
|
U.S.
&
Canada
International
International
by
Country
OPEC
OPEC
old
Detail
by State and Play
U.S.
Drilling
productivity
Drilled
Uncompleted
Wells
Shale
Revenue
Rigs
and O&G Revenue
Rigs,
Drilling
Costs & Revenue Index |
|
|
|
Workover
Rigs
-U.S. & Canada |
|
|
|
|
Wells |
|
|
|
|
Quarterly
Well Completions & Rig Efficiency
U.S.
Well
Completions & Footage |
|
|
|
Frac Spread
Count
|
|
|
|
|
Frac Spread Count |
|
|
|
Economy |
|
|
|
Petroleum
Imports
and Trade Deficit
|
|
|
|
|
Recessions
and Petroleum Consumption
|
|
|
|
|
Consumption &
Employment |
|
|
|
|
Recessions and Oil Price |
|
|
|
|
Recessions, Employment and
Oil Price |
|
|
|
|
Recessions and Housing
Starts
|
|
|
|
|
Industrial Production
|
|
|
|
Open Interest
|
|
|
|
|
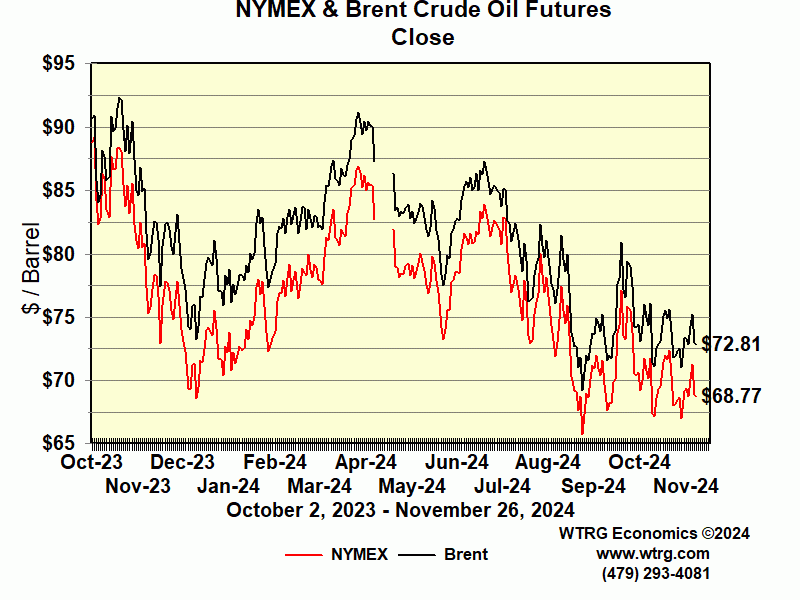
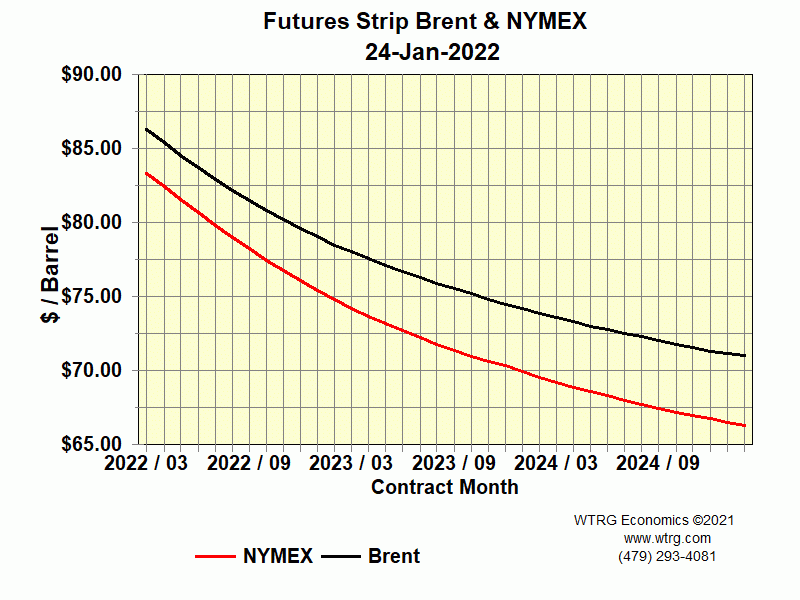
NYMEX Futures
Price and Open Interest
Brent Futures Price and
Open Interest
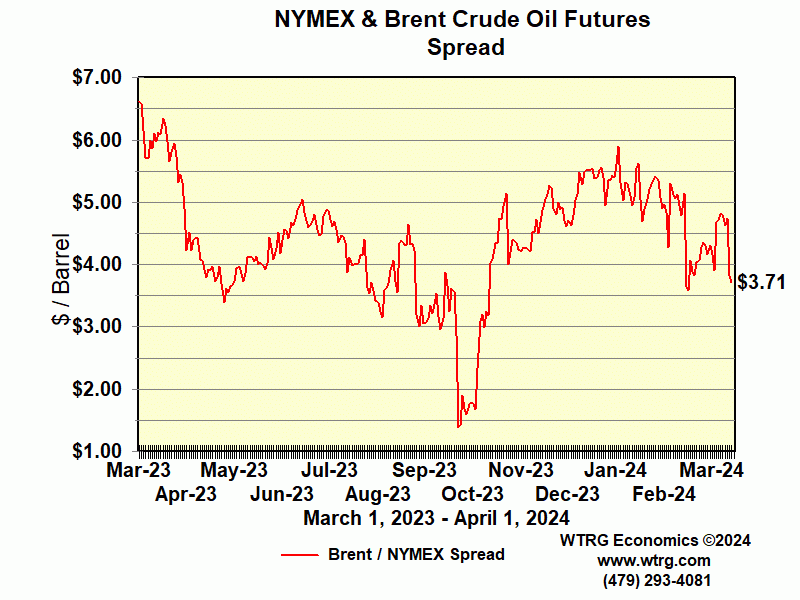
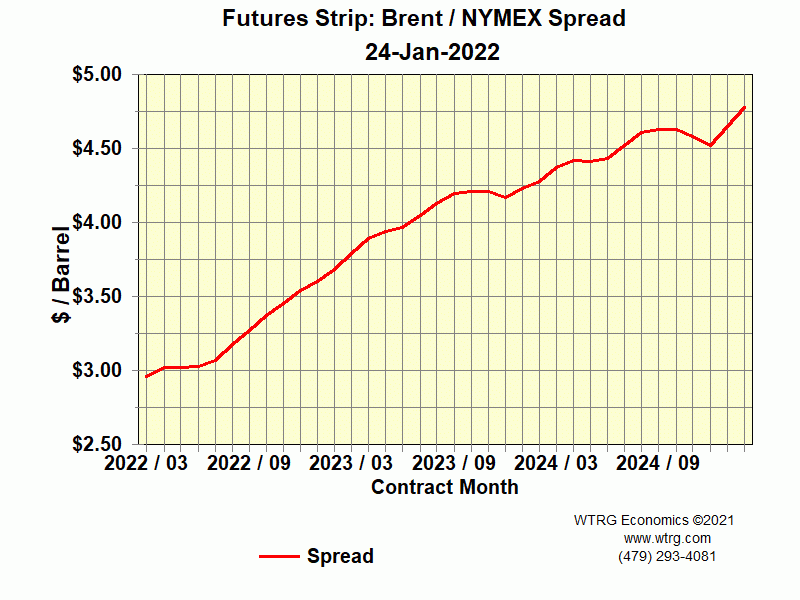
NYMEX / Brent
Contango / Backwardation |
|
|
|
CFTC |
|
|
|
|
Commitments of Traders
|
|
|
|
Long
Term Oil Price
|
|
|
|
|
First
Purchase
(Wellhead) Oil Price |
|
|
|
U.S.
Petroleum Production, Refining,
Consumption, Imports, Exports, Stocks |
|
|
|
Weekly Report
and Graphs June 10, 2022
|
|
|
|
Monthly
1973 - July 31, 2015
|
|
|
|
|
Monthly 1995 - July 31, 2015
|
|
|
|
|
Weekly
/ Monthly Data Comparison
|
|
|
|
|
Monthly
Exports
2000 - Present |
|
|
|
|
Monthly
Import
/
Exports 2000 - Present |
|
|
|
|
Stocks
at Cushing, Oklahoma |
|
|
|
Tight Oil Production
January 2000 - March 2017
|
|
|
|
|
Production
|
|
|
|
|
Table
|
|
|
|
State Oil Price & Production
Jan 1981 - February 2017
|
|
|
|
|
Production |
|
|
|
|
Table |
|
|
|
|
Selected
State
Prices
|
|
|
|
|
Table |
|
|
|
|
U.S.
Oil Prices, Production, Refining and
Imports by Quality
|
|
|
|
Petroleum Consumption by Product & Sector
|
|
|
|
|
Annual
Consumption 1949 - 2016
|
|
|
|
|
Monthly Sectors 1973 - December
2016
|
|
|
|
|
Monthly Sectors 1995 - December
2016
|
|
|
|
|
Monthly Products 1973 - December
2016 |
|
|
|
|
Monthly Products 1995 - December
2016 |
|
|
|
Energy Consumption
|
|
|
|
|
Annual
Consumption 1949 - 2019
|
|
|
|
|
Consumption
1775 - 2019 |
|
|
|
|
Energy
Density |
|
|
|
Automobile |
|
|
|
|
Passenger
Vehicle
Background |
|
|
|
Natural
Gas |
|
|
|
Supply
& Demand |
|
|
|
Short
Term
(January 2001-June
2018)
Table
|
|
|
|
Annual
1997
- 2014
|
|
|
|
|
Production |
|
|
|
|
Natural
Gas Production, Price & Rig Count
(thru
June
2018) |
|
|
|
|
Table |
|
|
|
|
Natural
Gas Production Shale Plays & Rig
Count April 2000 - June 2013
|
|
|
|
|
Storage |
|
|
|
Weekly
Storage
Report (November
20, 2020) |
|
|
|
|
Weekly
Storage
Report (November 6, 2015)
|
|
|
|
Liquid
Petroleum Gases
|
|
|
|
|
LPG
(April
2000 - June 2012) |
|
|
|
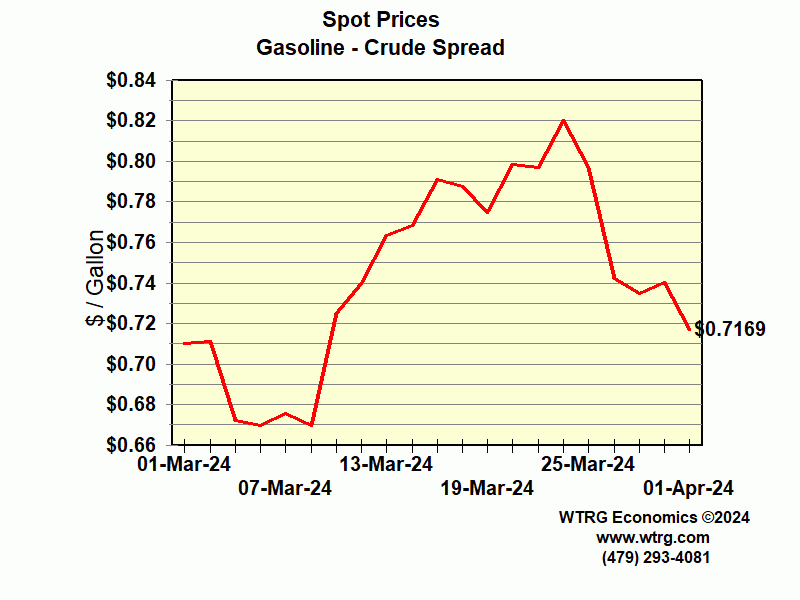
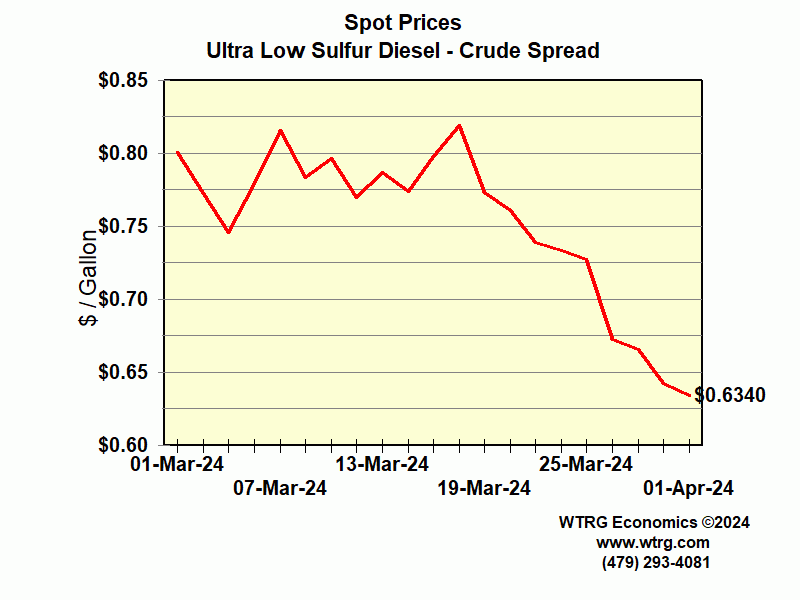
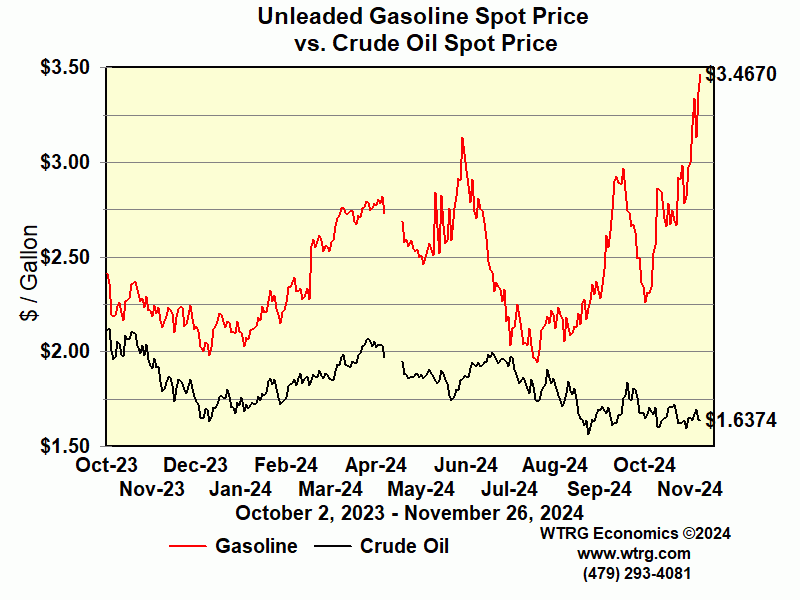
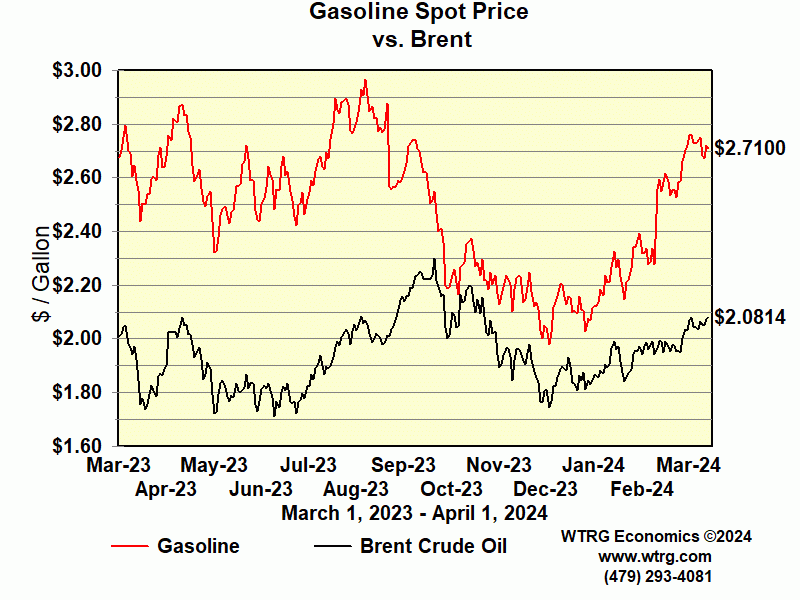
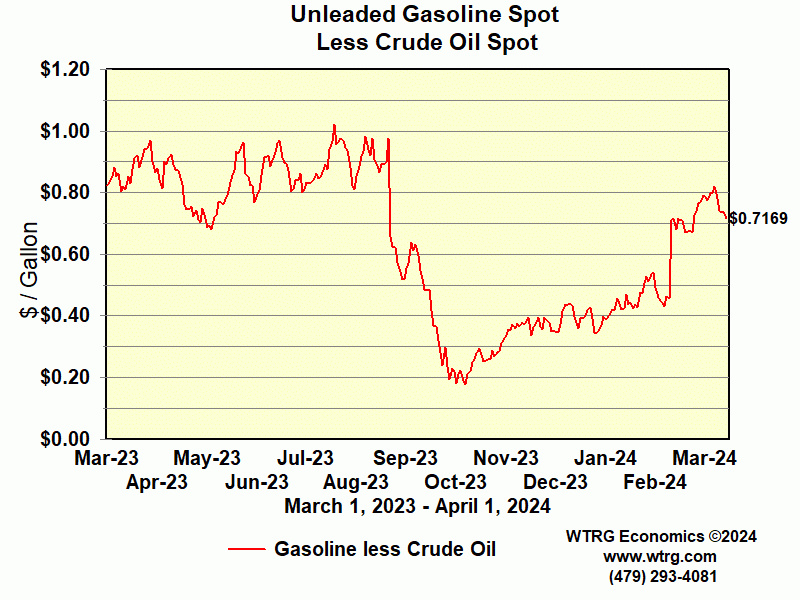
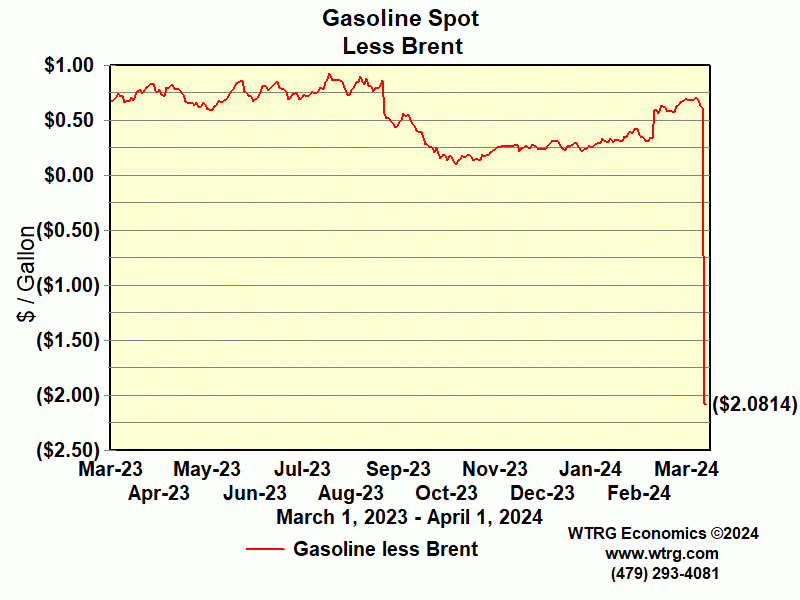
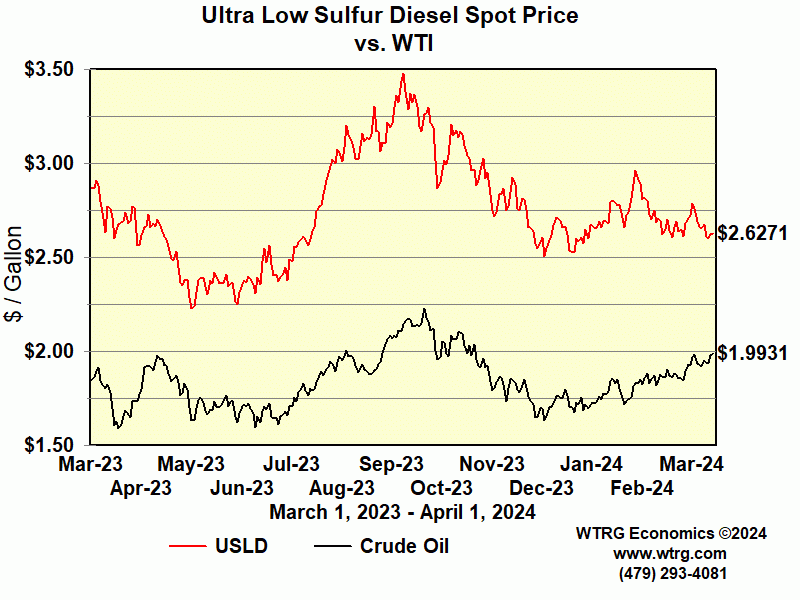
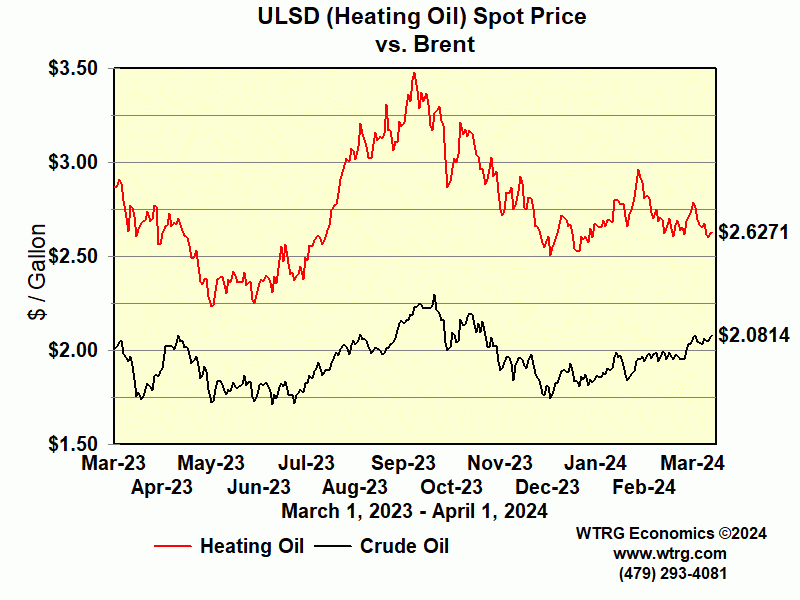
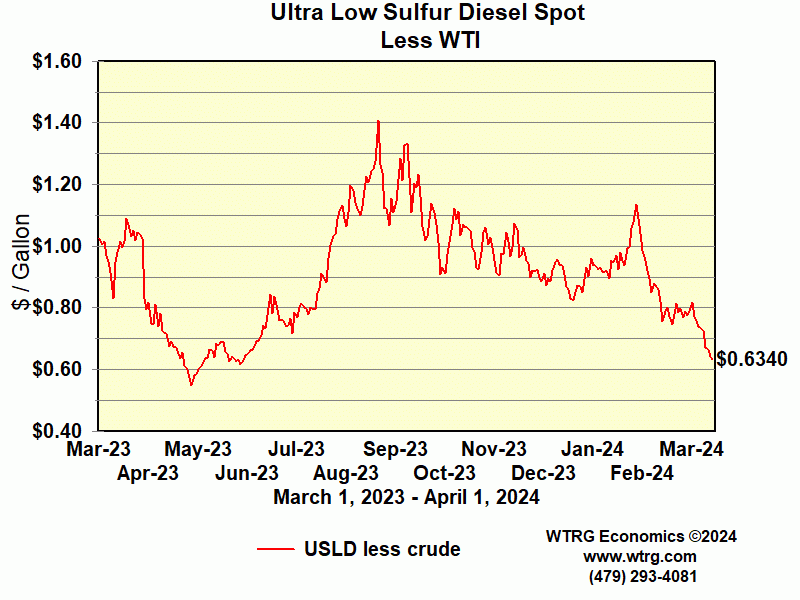
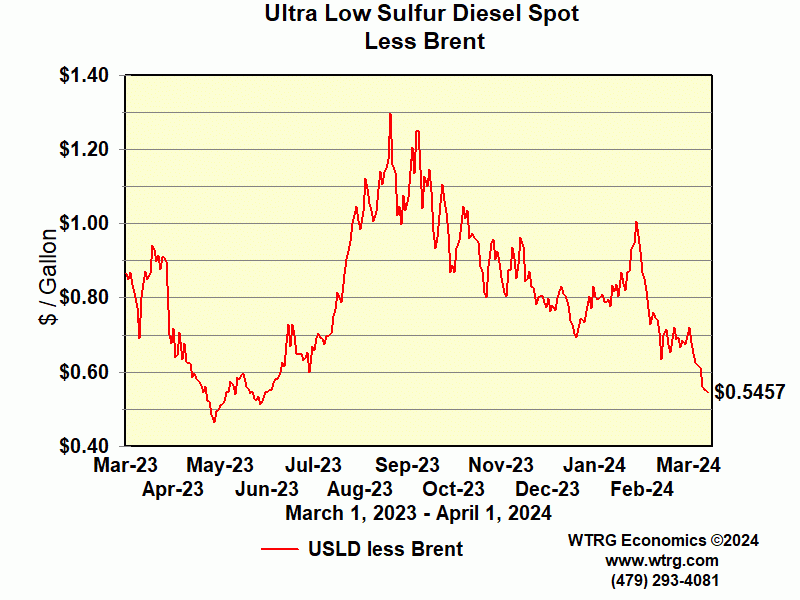
Spot Prices
- Crude and Products |
|
|
|
U.S. &
International |
|
|
Gasoline
Prices |
|
|
|
|
U.S.
Retail
Gasoline Prices |
|
|
|
International |
|
|
|
|
World Energy Consumption Cross
Section 2013 |
|
|
|
International Petroleum
|
|
|
|
|
World
Reserves |
|
|
|
|
International Petroleum
Supply, Demand and Stocks (January
1995 - May 2022) |
|
|
|
|
OPEC Oil Production
(January 1995 - May 2022) |
|
|
|
|
World
Oil Consumption (Annual 1965-2012) |
|
|
|
|
World
Oil Consumption & Production
(Annual 1965-2012)
|
|
|
|
|
Per
Capita
Petroleum Consumption (1965 - 2012)
|
|
|
|
|
World
Oil Reserves & Production (Annual
1980-2012)
|
|
|
|
|
World
Reserves
Table (2012)
|
|
|
|
|
|
|
|
|
International Coal
|
|
|
|
|
Annual Coal
Production & Consumption |
|
|
|
|
|
|
|
|
Crude Oil
Production |
|
|
|
OPEC,
Non-OPEC
by country (January 1990 - December
2017) |
|
|
|
|
OPEC,
Non-OPEC
by country (January 1973 - December
2017)
|
|
|
|
OPEC |
|
|
|
OPEC Production
vs Quota |
|
|
|
|
Excess
Capacity
|
|
|
|
|
Upstream
Projects
|
|
|
|
|
OPEC
Background Graphs |
|
|
|
|
OPEC
Income
and Oil Prices |
|
|
|
|
|
|
|
|
Gulf of Mexico |
|
|
|
|
Gustav / Ike Hurricane
Shut-In Production |
|
|
|
|
Katrina / Rita / Ivan
Hurricane Shut-In Production |
|
|


